
A bigger everyday payment network
 UPI has recorded another half-year of growth in
 India. The Economic Times attributes the figures to the
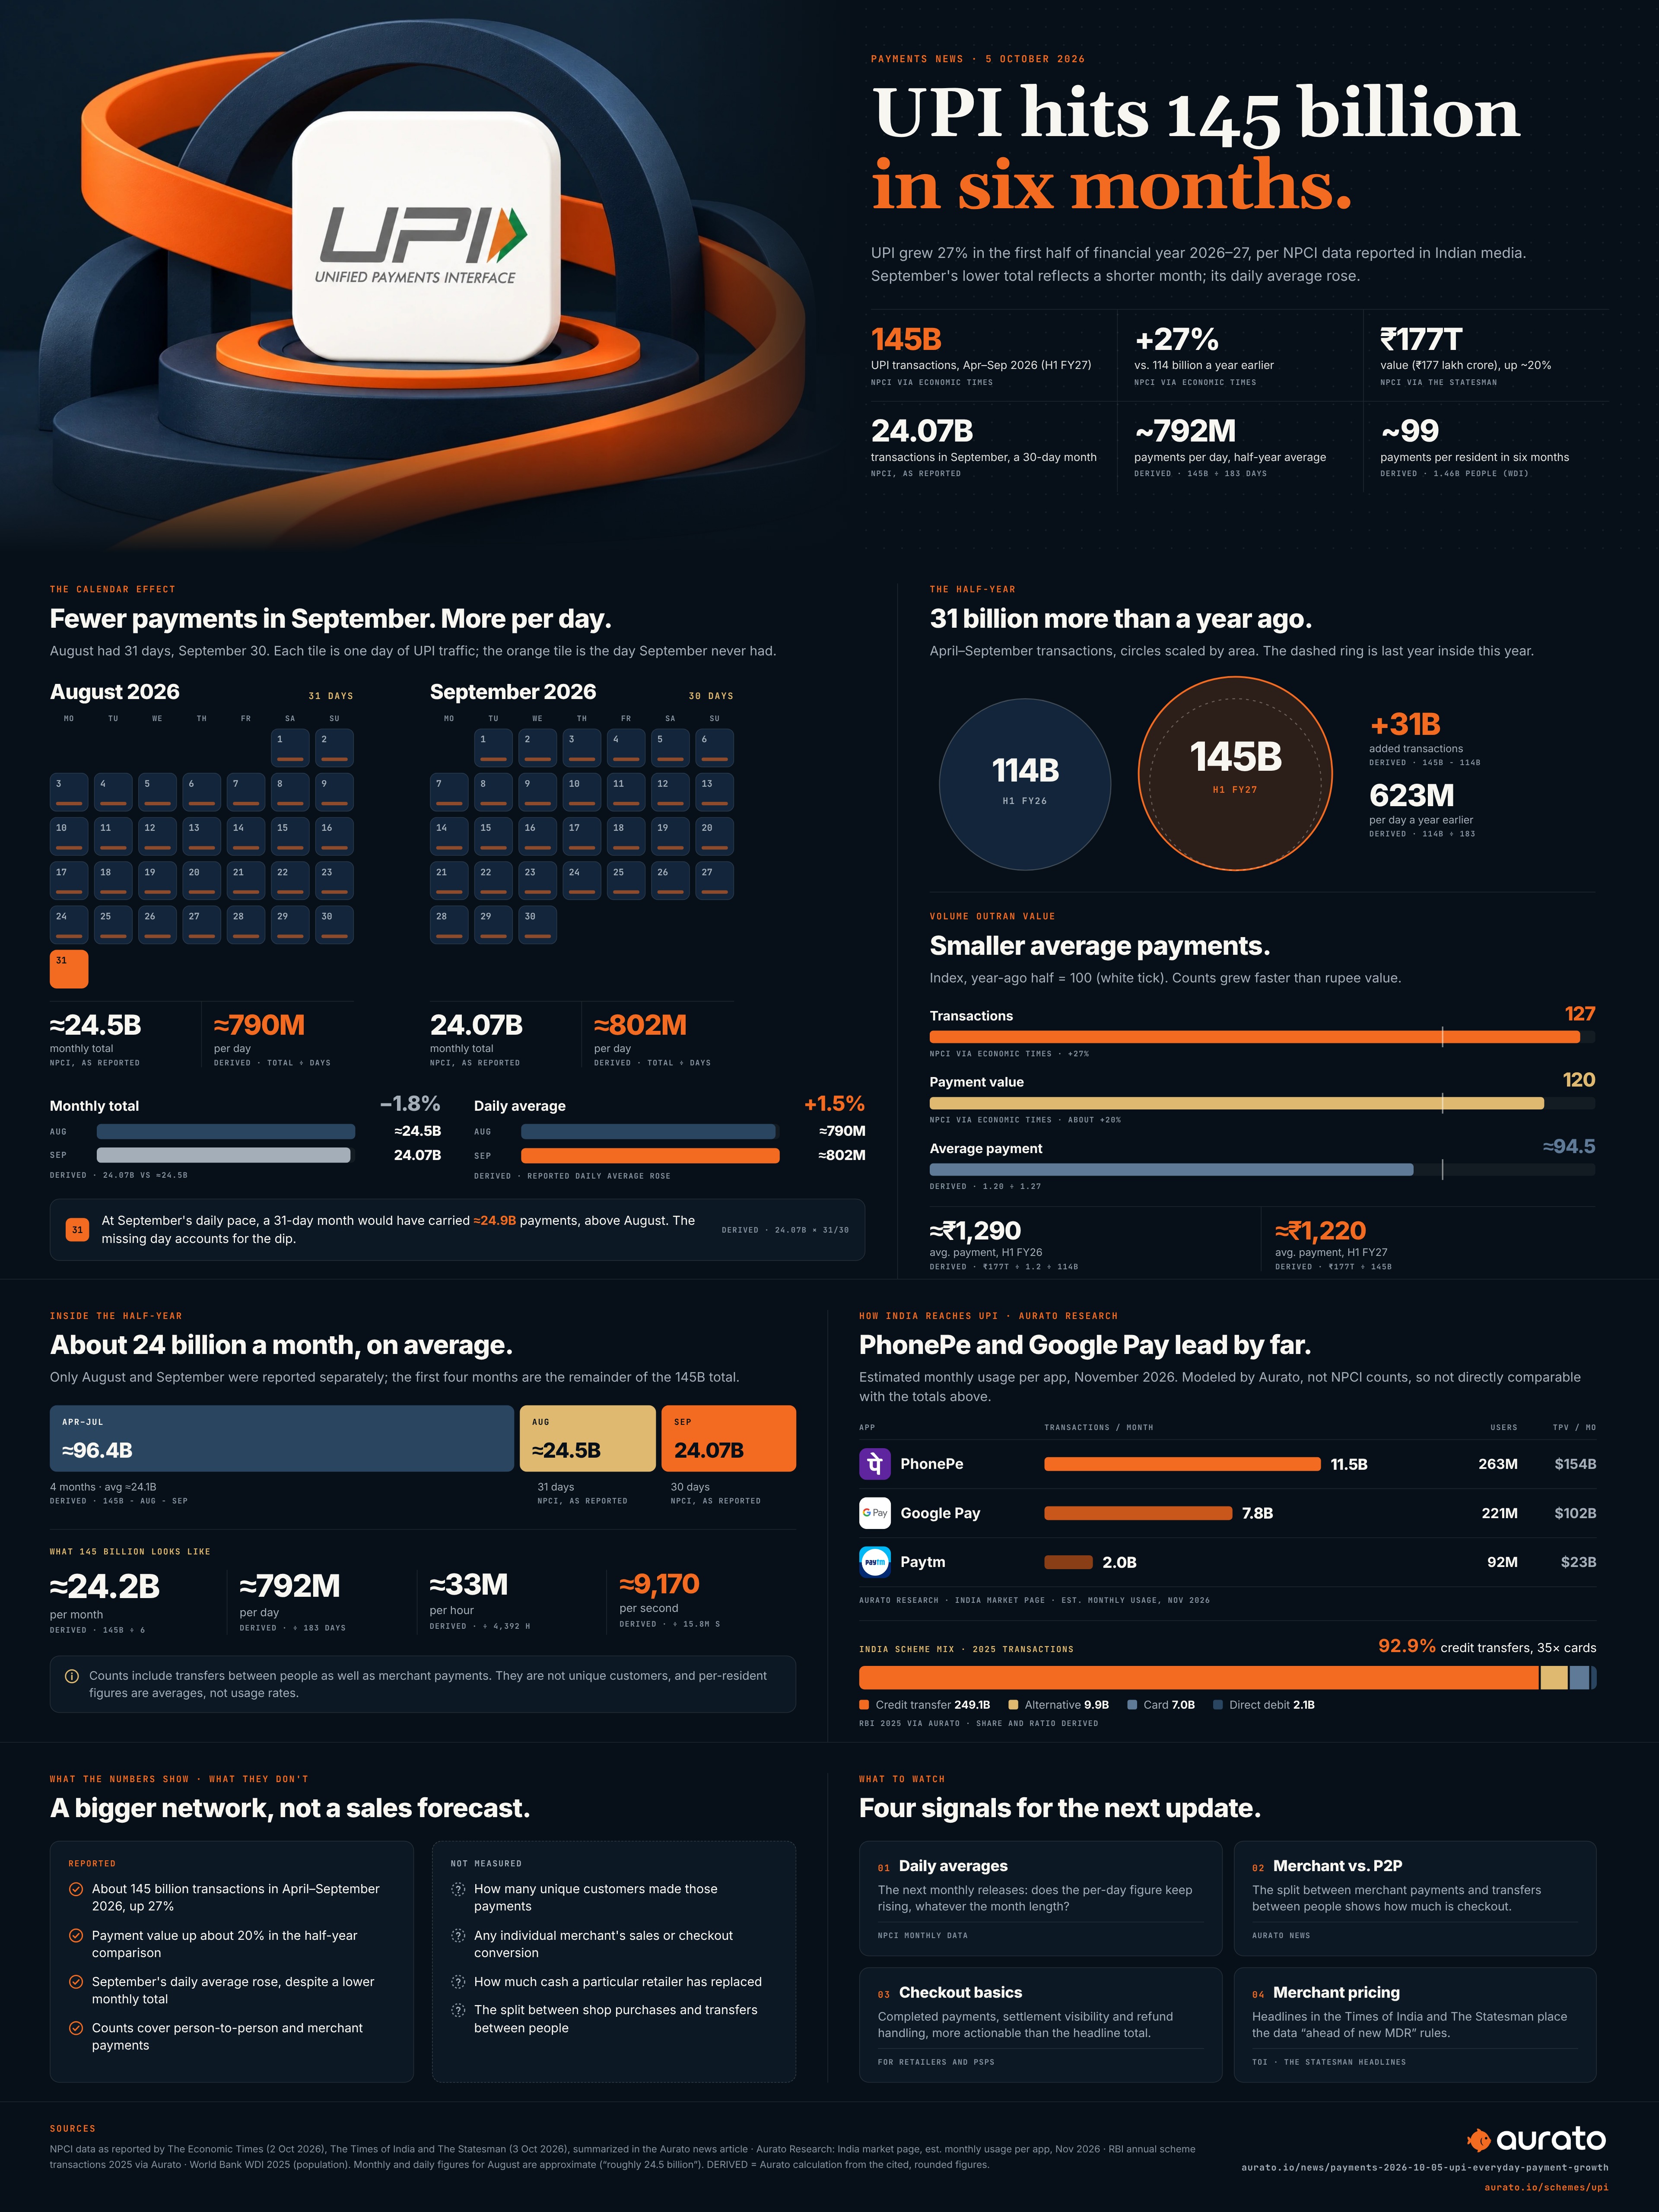
 National Payments Corporation of India: roughly 145 billion transactions in the first half of financial year 2026–27, compared with 114 billion a year earlier. Payment value rose about 20%.
September accounted for 24.07 billion transactions, below August’s roughly 24.5 billion. The Times of India and The Statesman explain the calendar effect: September had 30 days, August 31. The reported daily average increased, so the lower monthly total does not itself show that everyday usage slowed.
Why the checkout angle matters
For merchants, a widely used payment method can be more useful than another unfamiliar checkout brand. The commercial opportunity is to meet customers with an experience they already understand, then make confirmation, reconciliation and refunds equally straightforward.
For PSPs, scale raises the importance of routine reliability. A busy payment network needs to work at the ordinary shop counter as well as in a polished app demonstration. Growth creates an opportunity; it does not remove the need to explain a failed or pending payment clearly.
What these numbers cannot tell us
Transaction counts do not identify unique customers, an individual merchant’s sales or its checkout conversion rate. Nor does network-wide growth establish how much cash a particular retailer has replaced. Those questions need merchant-level evidence.
The half-year comparison and the month-to-month comparison answer different questions. Reading both prevents a one-day calendar difference from becoming a misleading decline story. It also keeps a large aggregate number from becoming a promise of growth for every business.
What to watch next
Watch the next daily-average figures alongside the split between merchant payments and transfers between people. For a retailer evaluating acceptance, practical measures such as completed payments, settlement visibility and refund handling will be more actionable than the headline total alone.
Related
Sources
- UPI transactions rise 27% to 145 billion in H1 FY27 ahead of new MDRThe Times of India
- UPI volume rises 27% to touch 145 billion in first half of FY27The Economic Times
- UPI transaction value rises 20% to Rs 177 lakh crore in H1 FY27 ahead of new MDR regimeThe Statesman
- UPI Transactions Rise 27% to 145 Billion in H1 FY27 Ahead of MDRDainik Jagran English